5 insights into income variability in the top 1%

5 insights into income variability in the top 1%
January 18, 2023 | By Ron Schmidt
If you stay current on the news, it won’t take long to spot a headline related to income inequality. Journalists frequently chronicle developments related to the ratio of CEO pay to the average worker, the wealth held by the top 1% of earners, and the implications of rising income inequality in the U.S.
While these conversations surrounding fairness and inequality are worthwhile, I have concluded that the income controlled by the top 1% of earners is not a meaningful measure of income inequality. To understand why, it is helpful to closely examine the changes in income sources and how these changes have increased the variability of income earned by the top 1% over the past 34 years.
Below, I present five data-based conclusions we can derive from examining the income of these two groups:
1) There is a significant amount of income variability between the top and bottom halves of the top 1%.
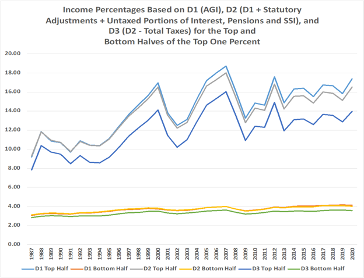
Chart 1
Many people imagine the top 1% of earners as a homogeneous group, but the data indicates that the top half and the bottom half of the 1% have experienced substantially different income patterns over the past three decades. During that period, one half of the top 1% of earners has experienced relatively stable incomes while the other half has experienced significant variation.
Looking at the plot for D2 (Adjusted Gross Income plus four untaxed income sources) in Chart 1, we can see the percentage of income declared on the returns of the bottom half of the 1% increased modestly from 3.1% to 4.1% of D2 on all returns.
In contrast, the top half of the 1% experienced significant swings. Overall, this group’s income increased from 9.3% to 16.5% of total D2, but there were three increases of 6.2, 5.8, and 4.0 percentage points. Sandwiched between these increases were two decreases of 4.3 and 5.2 percentage points.
2) This variability is largely the result of Schedule D gains.
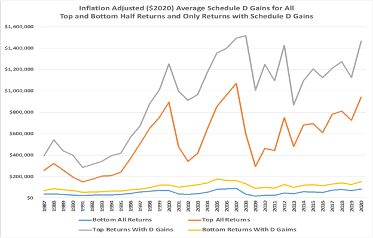
Chart 2
Most gains or losses realized from the sales of capital assets like stocks, bonds, and properties are declared on Schedule D of a filer’s return. Chart 2 shows that inflation-adjusted average Schedule D gains increased substantially from 1994 and 2000. The average for the top half was approximately seven times that for the bottom for 1994 and earlier but 13 times larger after 2000.
The average for all top-half returns also exhibits variation that is strikingly similar to that for the top-half income percentage in Chart 1. This suggests Schedule D gains may be the primary cause of the greater variation in the income percentage of the top half.
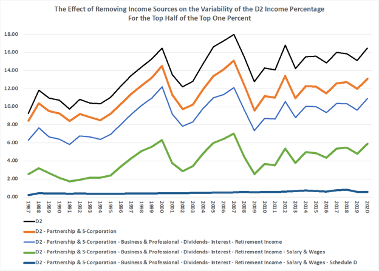
Chart 3
Chart 3 confirms our suspicion. It shows that the pattern of variation is unaffected by the removal of interest, dividends, retirement income, partnerships and S-corporation net income, and income of sole proprietors. Removing salary and wages, which includes components comparable to Schedule D, reduces the variability slightly. But it’s not until we remove income from Schedule D gains that major portions of the significant swings completely disappear. This demonstrates that the income variability experienced by the top half of the 1% is primarily the result of variation in Schedule D gains.
3) There are reasons to suspect that the increase in top-half Schedule D Gains is, to an important extent, the result of greater use of equity-linked compensation.
- The large increases in top-half Schedule D Gains and income percentage from 1994 to 2000 occurred during the Dot.com boom when startups used options to attract talent. Many established companies responded by doing the same to retain or attract talent.
- Many individuals who joined startups that were successful enough to merit an IPO became very wealthy. In each year from 1992 to 2000, the number of IPOs exceeded those for any other year from 1987 to 2020, the years covered by my work. In 1999, the average first day IPO return was 71.2%. In 2000, it was 56.3%.
- In 1993, Congress imposed a $1 million cap on tax deductions for CEO salaries but placed no limits on performance pay that included options. From 1993 to 2000, option grants for C-Suite executives increased substantially and many employees outside the C-Suite received grants.
- Options are risky and add greatly to the variability of executive pay. From 2001 to 2020, the percentage of CEOs receiving option grants fell from approximately 80% to 40%. Over that same period, the percentage of CEOs receiving grants of restricted stock, a significantly less volatile form of pay, increased from 25% to over 90%. Arguably, this change in compensation procedure is the reason that the top-half income percentage is less variable after 2011 even with the noticeable jump from 2019 to 2020.
4) The rise in LLCs and S-Corps has also played a role in raising individual income for the top half of the 1%.
While Capital D gains are primarily responsible for income increases in the top half of the 1%, the rise of S-Corporations and LLCs has also played a significant, albeit more minor, role.
Between 1993 and 2015, the number of S-Corporations more than doubled, from 1.9 million to 4.4 million, while the number of LLCs rose exponentially, from 17,300 to 2.5 million. The increase in this IRS category is significant because these businesses are not taxed as corporations. Instead, the income is passed through to individual tax returns. The data reflects an artificial shifting of income from corporate to individual returns, not a net increase in overall income.
5) Focusing on income percentage for the top 1% or top half of that group does not add to the discussion of income disparity.
Headlines about the ratio of CEO pay to that of the median employee may draw clicks, but they mislead readers. So do reports about the percentage of income accruing to top earners. Both foster a public perception that one economic pie funds all incomes, which leaves the incorrect impression that an income increase for the 1%, or its top half must be offset by an income decrease for those outside the 1%.
My analysis of IRS data for the years 1987 to 2020, however, points to the existence of more than one pie. I give considerable attention to Salary and Wages, Schedule D Gains and Partnership, and S-Corporation Net Income. Table-1 reveals the differences in the importance of the sources for the top and bottom halves of the 1% and those outside the 1% for the last two decades I examined. Salary and Wages constitute 70 percent of income (AGI plus four untaxed sources) for those outside the top 1%, 55.6 percent for the bottom half of the 1% but only 35.9 percent of top half income. Schedule D Gains are 27 percent of top half income but only a third of that amount for the bottom half. Both D Gains and Partnership and S-Corporation Net Income are tiny portions of income for those outside the 1%.
Table 1
Average Percentage of Income Derived from Three Sources for the
Two Halves of the 1% and All Other Returns from 2000 to 2020
Partnership &
Salary & Wages Schedule D S-Corporation
Top Half of 1% 35.9 27.0 20.0
Bottom Half of 1% 55.6 8.9 12.8
All Other Returns 70.0 2.1 2.0
The percentage of total income for top half of the 1% varies significantly because Schedule D Gains, an extremely variable source linked to movements of equity markets, are a significant portion of that group’s income. But a Schedule D-fueled increase in the income percentage for the top half of the 1% does not shrink aggregate Salary and Wages, the primary source from which those outside the 1% derive their incomes. Nor does a Schedule D-induced decrease in the top income percentage expand the funds available to pay the salaries and wages of those outside the 1%. In fact, the overall division of salary and wages between the 1% and all other filers varied little over the last two decades I examined despite substantial variation in Schedule D Gains and the top income percentage.
All of this means the percentage of total income on the returns of top earners is not a useful measure of income disparity. The public debate about income inequality in the U.S. should examine why some people struggle with incomes that are too small to fund the purchase of the most essential items. My study shows that the economic forces producing the large incomes that inflate the top income percentage in some years are not the cause of low incomes that force some to struggle every year.

Ron Schmidt is the Joseph T. and Janice M. Willett Professor of Business Administration at Simon Business School.
Follow the Dean’s Corner blog for more expert commentary on timely topics in business, economics, policy, and management education. To view other blogs in this series, visit the Dean's Corner Main Page.
Add new comment