Disruptions in debt markets in the COVID-19 crisis: What the data reveals

Disruptions in debt markets in the COVID-19 crisis: What the data reveals
April 28, 2021 | By Professor Alan Moreira
In March 2020, the US stock market experienced wild fluctuations as the arrival of the COVID-19 pandemic sent shock waves through the economy. Corporate debt markets were hit even harder, with Investment Grade (IG) falling by 20%, about as large as high-yield debt, and of a similar order of magnitude as stocks. These are really large numbers that should be a source of concern, as debt is typically much more stable than equity. An admittedly simplistic calculation explaining bond returns using their usual beta on equity would forecast a much smaller drop of about 5%.
Figure 2: Returns during the COVID-19 crisis across asset classes
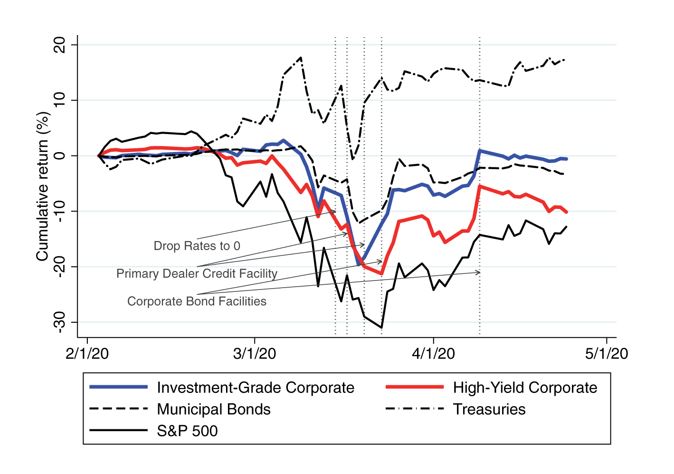
This figure reports the cumulative log returns for the stock market (S&P500), an investment-grade corporate bond ETF (LQD) , a high-yield corporate bond ETF (HYD), a long-term Treasury ETF (TLT), and a municipal bond ETF (MUB) through the COVID-19 crisis, from February to early April 2020.
In the months that followed, scholars and pundits floated several theories to explain the disruption. In "When Selling Becomes Viral: Disruptions in Debt Markets in the COVID-19 Crisis and the Fed’s Response," published in The Review of Financial Studies, my co-authors and I propose our own theory about why this happened.
What do we find?
First, we find a pervasive pattern of dislocations in debt prices, particularly in the investment-grade segment. During the drop, the capital-intensive bonds trade at a discount to CDS. The usually more liquid Exchange Traded Funds trade at a discount relative to their underlying bonds. Both of these dislocations amount to a large share of the overall price drop during this period.
Second, we find that specific interventions by the Fed, namely the announcement of bond purchases, played a large role in the price recovery. These observations tell us what can and cannot be behind the price movements, as we discuss below.
Ruling out the usual suspects.
At the beginning of our exploration, we considered several popular theories for why COVID-19 hit the debt markets so hard in the spring of 2020.
Theory #1 (Fundamentals & risk): With the onset of the pandemic, most of the American public experienced some degree of concern about the effect of COVID-19 on their jobs, their financial assets, and on the overall economy. If you were on the trading floor in the early days of the pandemic, it would be reasonable for you to expect that an impending economic crisis would cut into firms’ dividends and make highly leveraged firms even riskier. According to this theory, the economic impact of COVID-19 made firms less valuable and caused the debt market to plummet.
Theory #2 (Blame the banks): Other observers saw banks and intermediaries as the primary culprit in a rerun of 2008. This time, though, the banks were too constrained by financial regulations to step up and buy enough corporate bonds to stabilize the debt market, the thinking goes.
Solving the puzzle.
Both theories are plausible, but the data doesn’t back them up.
One of the first things we noticed in our research was that bond spreads increased, but credit default swaps (CDS) didn’t budge, even with firms like Google that have negative leverage. This points to something other than fundamentals as the likely answer.
Figure 1: Google: Bond spread and CDS spread
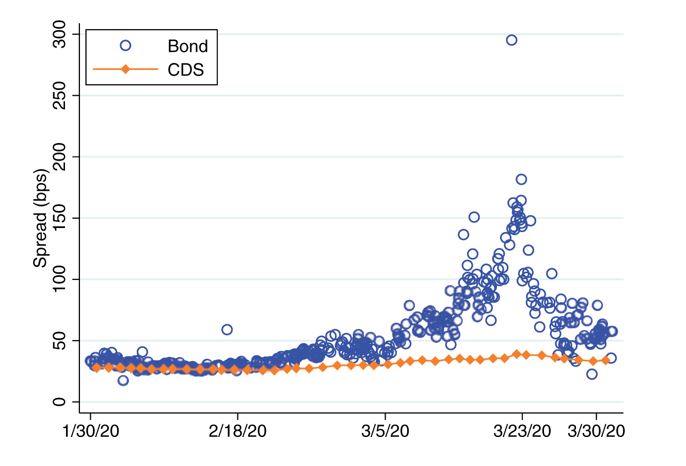
The bond spread is in blue. Each dot is a transaction in the TRACE data. The CDS spread is in red.
By comparing the events of 2020 with the bank-centric disruptions of 2008, we learn that the valuation gap between bonds and CDS increased much more on Investment-grade bonds than with much riskier High-yield bonds this time. This is a puzzle for the bank-centric view because trading High-yield bonds requires more capital.
Figure 4: CDS-bond basis
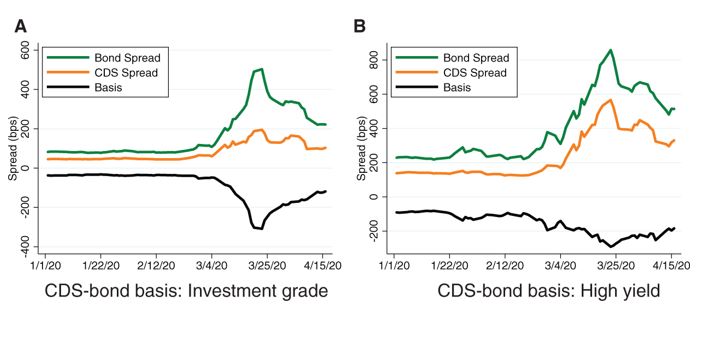
The figure plots the median CDS-bond basis (green line) for investment-grade bonds in the LQD portfolio that have CDS contracts present in the CDX IG basket (panel A) and high-yield bonds in the HYG portfolio with CDS contracts present in the CDX HY basket (panel B). The green line is the bond spread, the orange line is the CDS spread, and the black line is the basis. See text for data construction.
After examining the data, we can answer to the question of why COVID-19 hit bond markets so hard in one word: liquidity.
Essentially, everyone wanted to convert bonds into cash at the same time. Investors and businesses foresaw the devastating impact of COVID-19 and recognized the need for greater liquidity to make payroll. Concerned about unemployment, individuals suddenly wanted cash on hand to cover their commitments. Foreign governments, in turn, predicted shutdowns that would impact tax revenues. Most don’t have the same capacity to issue debt, so they sold foreign reserves in the US.
Fortunately, the Federal Reserve broke new ground when it announced that it would step in and provide liquidity by being willing to buy risky assets. In fact, exactly because some of the Fed’s interventions were so unprecedented, the asset price responses to the announcement allowed us to very cleanly measure the direct effect of the policy.
The first announcement I want to draw you attention to is from March 23, 2020. That's when the Fed first announced it would buy corporate bonds. The most important thing to recognize is that this was just an announcement: the Fed didn't actually go on a buying spree in the following months.
Figure 7: Event study around Fed announcements of bond purchases
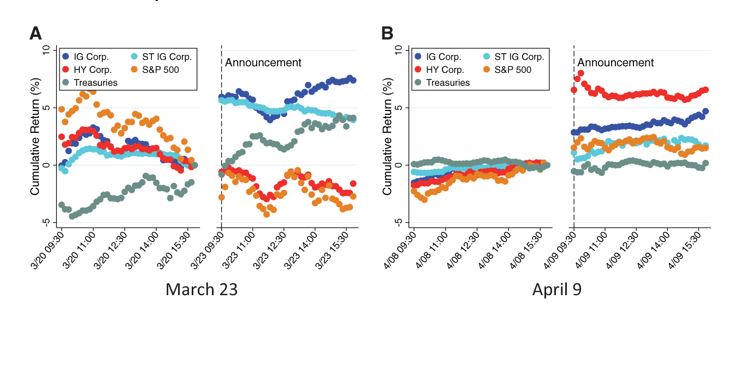
The figure shows traded prices on selected ETFs around the Fed announcements of March 23 and April 9 at 10-minute intervals. We compute returns relative to last observation before the announcement to aid visualization. The timing of the Fed announcements is denoted by the dashed vertical line.
In the chart above, I plot the cumulative return across different categories. You see a very sharp increase in the price of investment-grade debt: Both short-term and long-term recover by 6%, about a third of the decrease in the previous month. This response is very segmented to investment-grade debt. You see no jump in High-yield, treasuries, or stocks.
The other announcement that played a significant role in stabilizing bond prices was the expansion of Fed policy both in scale and in scope on April 9, 2020. This is what people think of as the "whatever it takes" moment of this crisis, with the Fed pulling out the big guns in terms of market participation. Here you see a large recovery across asset classes, with High-yield bonds recovering the most.
In the end, the Fed didn’t have to buy much. It only had to say it would in order to give banks the confidence to stay in the market. Prices soon stabilized, and the storm clouds passed. Of course, this does not negate the long-term implication of the Fed’s policy. If financial markets were to deteriorate more, the Fed would have to buy billions of corporate bonds, exposing taxpayers to sizable risks.
Why it matters.
If bond markets didn’t recover from the acute events of March 2020, countless firms wouldn’t have been able to issue bonds to stay afloat and pay their employees. The average American may not track bond markets or pay attention to announcements from the Federal Reserve, but they need corporate bond markets to function so that their employers can issue their next paycheck.
By pointing to the source of the bond market disruption, my colleagues and I aim to inform the discussion about how to better manage liquidity shocks in the future and how to evaluate the heavy reliance on the Federal Reserve when these situations do arise. The data tells a story, and if we search hard enough to find it, we can contribute to positive financial outcomes for more Americans down the road.
To learn more, view a short presentation.
Follow the Dean’s Corner blog for more expert commentary on timely topics in business, economics, policy, and management education.

Alan Moreira is an Associate Professor of Finance at the Simon Business School.
Add new comment