How long is the wait?
How long is the wait?
October 17, 2023 | Ricky Roet-Green
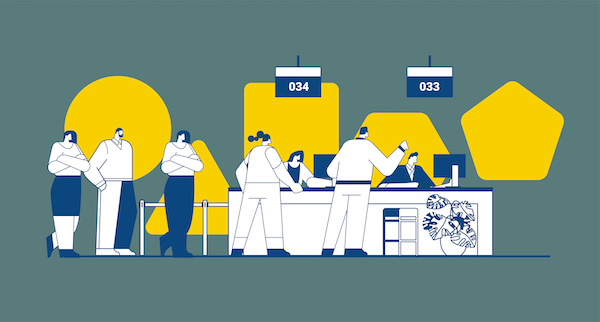
Like most people, I try to avoid long lines whenever possible. My motivation to study the theory behind waiting—known as strategic queueing—is both academic and practical. Fortunately, there is inspiration all around me.
Traditional queueing theory focuses on the ways in which service providers design queues to maximize performance and efficiency. In some settings, this means maximizing revenue, while in others it means maximizing social welfare.
But queueing theory only considers one half of the equation. Service providers can design and maintain a queue however they want, but they can’t just assume their customers will comply.
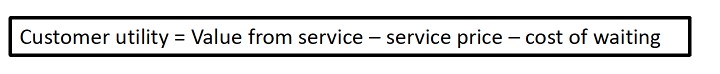
The customer has their own set of criteria to consider. The overall benefit they derive from waiting in a line is generally measured by the value of the service minus the cost of the service and the cost of waiting for it.
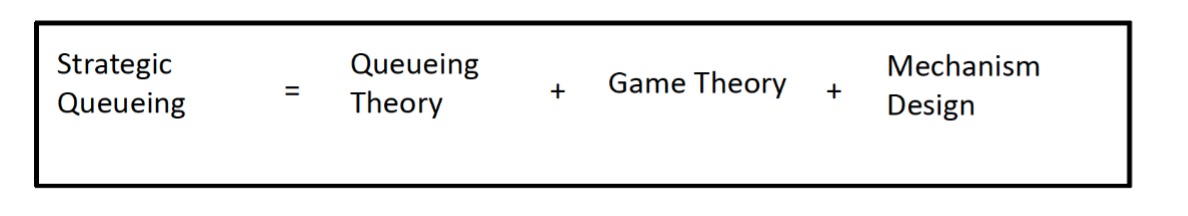
Strategic queueing considers the customer side of the equation, introducing concepts from game theory to predict and analyze how different players make decisions within a given design.
At Simon, I research strategic queueing with the aim of helping service providers improve the customer experience by making queues shorter and more efficient.
One of the key facets of this research is the availability of information, i.e., how transparent service providers are about wait times.
Below, I present five insights into providing wait time information to customers:
1) When it comes to providing wait time information, service providers have four basic options.
- Unobservable queues— Customers have no information about wait times and must make a quick decision about whether to join or balk.
- Observable queues— Customers have full information about wait times that they don’t have to do anything to access; it is just posted publicly for all to see.
- Observable at a cost— Customers can access information about wait times at a cost (can be measured in time spent looking something up).
- Partial observability – Customers have access to some of the information and use it to infer their expected wait times.
2) For service providers, the optimal amount of wait time information to provide depends on congestion level and service value.
In “The Impact of Inspection Cost on Equilibrium, Revenue, and Social Welfare in a Single-Server Queue” (2017), we ask a fundamental question: What is the optimal transparency policy for maximizing revenue or social welfare?
To explore this question, we took a closer look at wait times in hospital emergency departments.
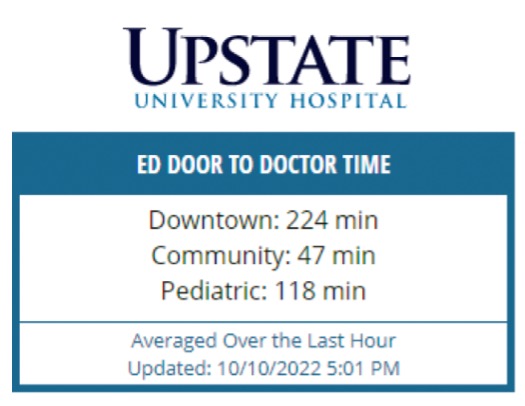
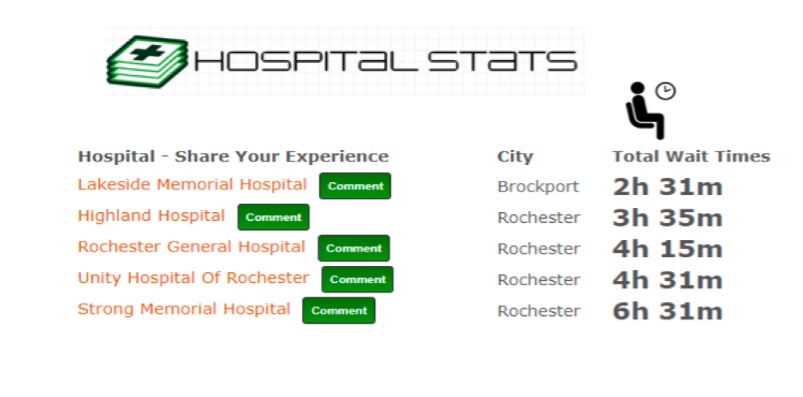
Many hospitals display wait times on their websites or provide this information through a third-party service. Some list the wait time between first arrival and first triage, while others calculate the time it takes to see a physician.
We examined the best course of action for a hospital—provide no wait time information, provide it fully (by displaying it for all patients to see), or providing it at a cost (like posting on a website that a patient must search).
We found that the optimal solution depends entirely on congestion level (which is the ratio between the demand and the service capacity), and service value. To simplify, we focus here on the case where demand does not exceed the service capacity, which means congestion level is normalized between 0 and 1, with 1 being the maximum congestion level.
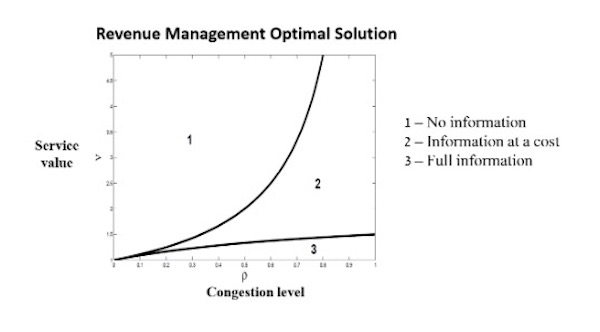
Figure 1
When the service value to patients is high but congestion is low, the optimal for service providers seeking to maximize revenue is not to provide any wait time information. If wait times are usually low, it is unhelpful to display the odd time when it is high and risk scaring off people who highly value the service.
When the service value is low and congestion is high, providing full information is optimal. High congestion means that customers are more discouraged. By providing wait times, a service provider signals customers to join when the queue is not that long; without that information, a high proportion of the customers would rather not join to avoid a potentially long wait.
When congestion is relatively high and at the same time service value is not too low, some customers would join even without knowing the expected wait time. Others would not join without information and therefore will choose the option of inspecting the queue length at a cost, joining only if they find the wait time reasonable. Thus, in the latter case, providing wait time information at a cost achieves the maximum revenue.
3) Customers are usually better off with more information.
In "On Queue-Length Information When Customers Travel to a Queue" (2021), we examined the same decision-making process as the one that takes place in a hospital queue—but with a new factor added in: distance. It’s only a 1.5-hour drive from Rochester to the U.S.-Canada border, but it’s long enough for people to become frustrated if they inadvertently choose a busy time to cross.
Travelers planning to cross the border at Buffalo and Niagara Falls must decide whether and when to leave home without being able to see the queue. Luckily, travelers can find the current wait time posted online by the U.S. and Canadian border agencies.
In our research, we found that just as in the hospital scenario, the service provider benefits from providing this information when they face high congestion, which affirms the disclosure policy adopted by the U.S. and Canadian agencies.
Our research also shows that social welfare is maximized by having more information. No matter what the level of congestion, travelers always benefit from having as much information as possible so that they can make more informed decisions about if and when to travel to receive a service. This result is relatively common in other scenarios as well, but in some recent work we show that in certain circumstances, more information can hurt social welfare.
4) In a two-part waiting system, the interests of service providers and customers diverge.
In a working paper (available here), we examine the dynamics of a two-part queuing system. The scenario we study is similar to the popular Maid of the Mist boat ride attraction at Niagara Falls, which requires customers to wait in two lines—one to buy a ticket and the second to board the boat.
In this paper, we determine the benefits of offering two-part information about wait times. Currently, visitors can observe the line in front of the ticket booth, but no information is available on wait times for Maid of the Mist boarding. Visitors may walk right onto the boat or wait several hours to board, depending on congestion.
Our analysis confirms that the current policy supports the goals of the Maid of the Mist service provider, which is maximizing revenue. We found that full transparency regarding the entire system—in other words, providing real-time information on wait times for both parts of the experience—may result in lower revenue for the service provider but more benefit to the customer. Thus, when considering public services that have similar two-stage waiting lines (for example, the DMV), social welfare is maximized when full wait time information is available to the public.
5) A shared waiting room changes things.
In another working paper (available here), my PhD student and I look at a system in which there are customers of multiple service providers waiting in a shared waiting area. Think of a food court in an airport where customers sit down and order from a variety of restaurants on a tablet. Someone who has just walked in can’t tell which customers have ordered from which restaurant and will have hard time estimating the service wait time.
We ask which design is better: sharing the waiting area or splitting it to designated waiting areas for each service? With designated waiting areas, it is easier for the customers to estimate the wait time for service; when the waiting area is shared, the estimation becomes much more difficult and the risk of a long waiting increases.
We found that if the demand for services in the shared waiting area is similar across the different services, creating designated waiting areas leads to higher revenue for service providers only when congestion is high. But regardless of congestion level, customers benefit from having designated waiting areas because designated areas provide more information about expected wait times. When the demand varies between the different services, the results are more involved, and it is no longer true that more information is always better for customers.
The Bottom Line
Wait time information provides a missing puzzle piece for understanding the decisions that service providers and customers make. The disclosure policy that service providers choose may result in higher revenue or higher social welfare. Overall, when congestion is high, sharing wait-time information may benefit both providers and customers, keeping everyone happy.

Ricky Roet-Green is an Associate Professor of Operations Management at Simon Business School.
Follow the Dean’s Corner blog for more expert commentary on timely topics in business, economics, policy, and management education. To view other blogs in this series, visit the Dean's Corner Main Page.
Add new comment