5 things to know about U.S. debt

5 things to know about U.S. debt
August 2, 2023 | By Dean Sevin Yeltekin and Jack Peyre
In this blog, Dean Sevin Yeltekin and economics student Jack Peyre debunk myths and misconceptions surrounding U.S. public debt.
Every time the federal government reaches its borrowing limit, the U.S. economy hovers at the precipice of disaster. In this political climate, what should be a straightforward congressional action to raise the limit becomes a partisan squabble with massive economic implications. With $25 trillion of bonds held by the public—or one third of the global total—the U.S. houses the world’s largest sovereign debt market. A default would send shock waves through financial markets around the world, precipitating an avoidable recession.
After the U.S. Treasury spent six months depleting its cash holdings in anticipation of the June 1st deadline to raise the debt ceiling, currently $31.4 trillion, Congress voted to suspend the debt ceiling in the nick of time. It looked for a time like crisis was averted, but on August 1, Fitch Ratings downgraded the U.S. sovereign credit rating from the highest AAA rating to AA+, citing "a steady deterioration in standards of governance.”
In addition to dinging the country’s credit rating unnecessarily, debt ceiling negotiations shone a spotlight on commonly held misconceptions surrounding the financing, sustainability, and ownership of U.S. debt.
It’s time to revisit U.S. debt. Below, we offer five insights to help frame our collective thinking on this contentious issue:
1) Stop bean counting and put the debt numbers in their proper context.
On the western side of Midtown Manhattan’s One Bryant Park, you can spot the National Debt Clock, a billboard-sized running total that displays the U.S. gross national debt and each U.S. family’s share of the debt. These types of bean counting are only effective at inducing public alarm. They fail to present an accurate picture of the debt for three key reasons:
First, they neglect to put the debt in context by establishing a debt/GDP ratio, which is more useful for gauging the scale of the debt than watching a debt clock run up. Second, they quantify total debt/GDP instead of marketable debt/GDP. We should be focusing entirely on marketable debt/GDP, as debt held in intergovernmental accounts is not market-priced. Third, they look at the par value of publicly held debt/GDP when they should be looking at market value—that is, the true market price that a bond would be redeemed at if every bond holder lined up in front of the U.S. Treasury today. This value hovers around 85% of GDP, having come down 20% points from the peak of the COVID pandemic and the associated fiscal stimulus.
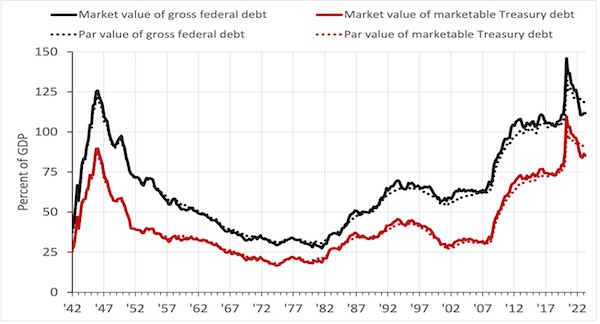
Sources: Federal Reserve Bank of Dallas (debt data), Federal Reserve Bank of St. Louis (GDP)
2) A significant portion of federal debt is held by the Federal Reserve.
There is a common misconception that members of the public are poised to dump their bond holdings en masse as soon as they determine that the national debt has grown unsustainable. A second unfounded concern is that the U.S. is uniquely vulnerable to debt dumping by foreign investors. In reality, the majority of debt is held domestically, by a combination of the Federal Reserve and domestic investors. Federal debt held by foreign investors has fallen from close to 50% during the Great Recession to less than 30% today, while federal debt held by Federal Reserve banks has grown from approximately 15% to 25% in the same period. Federal debt held by private domestic investors is also on an upward trend.
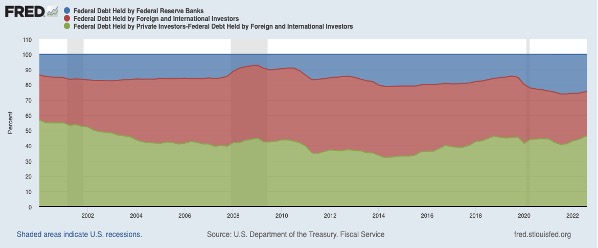
Foreign investors have few safe assets in which to dump their debt—doing so would hurt them just as much as it hurts the U.S. It would make even less sense for the Federal Reserve to shoot an arrow in the heart of the financial system that it is tasked with keeping alive and well—not to mention that any profits made by the Federal Reserve provides a windfall transfer for the Treasury every year.
3) The cost to service debt is measured incorrectly.
The U.S. government calculates its actual interest burden using a “cost of funds” (cost of interest) measure, which incorrectly calculates explicit interest expenses (the real capital gains on one-period discount bonds) and ignores implicit interest expenses (the capital gains earned by the public for holding longer bonds). Economists Hall & Sargent (1997) suggest a method for calculating a more accurate cost of funds. Below are two charts using this methodology, one from Berndt, Lustig, Yeltekin (2012) displaying the real holding returns on government debt between 1946-2008 and the other from Hall & Sargent (2022) displaying the cumulative real returns after three “wars”: WWI, WWII, and the COVID-19 period.
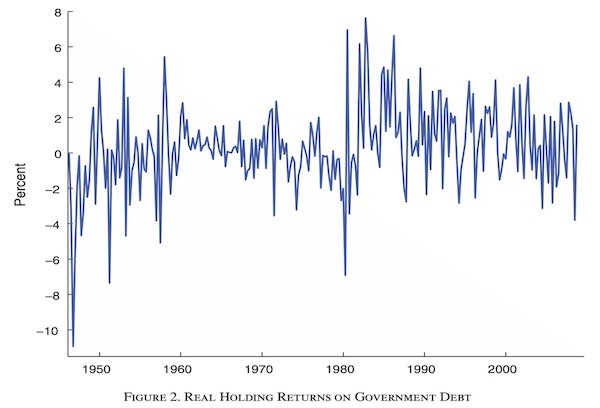
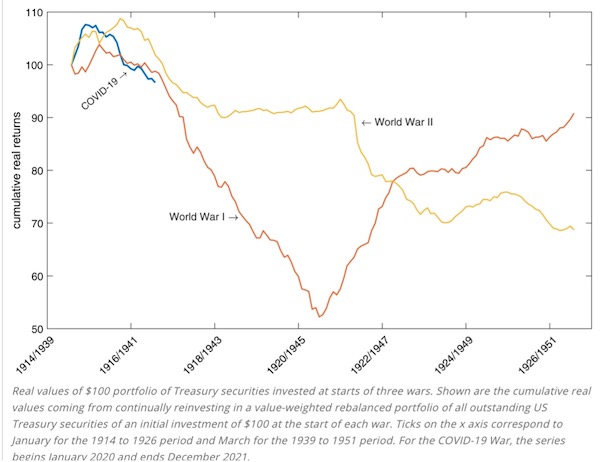
These two figures show that the U.S. government, on average, delivers a fairly junky negative real return to owners of federal bonds, largely through increases in the price level. This is particularly pronounced for WWI and WWII. While the Covid-19 period is yet to be determined, the trajectory so far replicates those for the two world wars. In other words, even in periods of higher interest, the cost of servicing the debt is overstated. People invest in government bonds because they are safe, low-risk assets, not because they yield high real returns.
4) Standard rules of thumb about debt sustainability are unsupported by evidence.
There is something appealing about establishing a formula or a principle that can guide decision making surrounding public policy issues. Rules of thumb are clear, useful, and easy to remember. Unfortunately, they are not always grounded in reality. In 2010, a highly cited paper by Harvard economists Reinhart and Rogoff claims that when a country’s level of public debt exceeds 90% of GDP, its economic engines will sputter dramatically and GDP will be slashed in half. The paper has since been discredited for containing faulty calculations, but the 90% number stuck around. Others have tried to establish another rule of thumb for the limits of debt sustainability: r<g, which means that the rate of return on capital is lower than the rate of economic growth. This, too, lacks robust theoretical and evidentiary support.
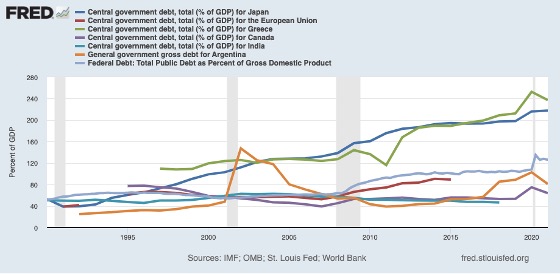
The truth makes for a less sticky soundbite than a rule of thumb. High debt/GDP ratios may indicate an impending debt crisis, as with Greece entering its lengthy battle with public debt in 2009 with a debt/GDP of 140%, but countries like Japan have maintained a debt/GDP of well over 150% for more than a decade without experiencing a major debt crisis. On the other hand, In 2020, Argentina defaulted on its debt with a ratio of 100%. As the chart below reveals, the U.S. debt/GDP ratio is higher than countries like Canada or India but lower than countries like Japan and Greece. We only need to take a look around to recognize the limitations of relying on a debt/GDP ratio as a predictive measure.
5) The debt ceiling is a politically manufactured problem.
Since the post-WWII era, members on both sides of the aisle have periodically feuded over the debt ceiling before reaching an inevitable eleventh-hour agreement to avoid default. The U.S. debt ceiling is only economically and fiscally relevant in that it forces the members of Congress to examine and negotiate changes to spending. It is a political game of chicken that only becomes an economic crisis when political maneuvering careens out of control. There are certainly politicians who savor the debt ceiling battle as they gain leverage to gain concessions from the opposing party, but economists do not share their enthusiasm. With the reputation and credibility of the U.S. dollar and bond on the line, the consequences of playing games are sobering. While the U.S. avoided default, the downgrade to its credit rating is an embarrassing indictment of its ongoing political dysfunction.
***
As the national attention turns once again to the issue of U.S. debt, we have an opportunity to bring much-needed clarity to waters that are muddied by myths and misconceptions. By taking a more evidence-based look at the context, financing, and ownership of debt, we can take a step closer to fiscal and monetary policies that strengthen the U.S. financial system instead of undermining it.


Sevin Yeltekin is the Dean of Simon Business School.
Jack Peyre is a rising senior at Pittsford Mendon High School and a Simon Business summer intern.
Follow the Dean’s Corner blog for more expert commentary on timely topics in business, economics, policy, and management education. To view other blogs in this series, visit the Dean's Corner Main Page.
Related Blogs
-
 AGI could emerge within decades, bringing risks like job loss, misuse, misalignment, and even consciousness. Are we ready? Prof. Huaxia Rui explores the stakes.
 -
 The new Department of Government Efficiency (DOGE) sparks debate. Is it streamlining bureaucracy or pushing privatization? Joseph Kalmenovitz unpacks its impact in this Q&A.
 -
 Understanding Creditor Rights and Their Impact February, 26 2025 | By Giulio Trigilia Creditor rights are often seen as a key driver of investment and economic growth, but research suggests the reality is more complex. While stronger protections can improve borrowing conditions in competitive
 -
 Online steering shapes how we shop, but is it fair? Simon professors Andras Miklos & Jeanine Miklos-Thal explore its ethical and economic impact in a new paper.
 -
 AI regulation must balance innovation and fairness. A recent keynote at Simon explored how competition and antitrust shape the evolving AI landscape.
 -
 In this blog, Simon alumnus Josh Goldberg explains the 25-year journey of model risk management.
 -
 In this blog, Dean Sevin Yeltekin points to productivity as the key ingredient that drives US economic growth.
 -
 ChatGPT as a Marketing Assistant October 16 | By Professor Professor Paul Ellickson In this blog post, Professor Paul Ellickson describes the potential of machine learning and Generative AI tools to predict and improve the performance of marketing campaigns. Identifying and optimizing targeted
 -
 In this blog, Professor Alan Moreira unpacks the effects of policy promises on financial markets.
 -
 Professor Narayana Kocherlakota points to real wage decline to explain widespread voter pessimism about the U.S. economy.
 -
 In this blog, Dean Sevin Yeltekin and Simon summer intern Defne Olgun take a closer look at the mismatch between economic indicators and voter perception.
 -
 Partisan Regulatory Actions July 3 | By Vivek Pandey Professor Vivek Pandey presents evidence that the SEC treats firms differently based on political ideology. It’s no secret that Americans are more politically divided than ever. Intense political polarization has crept into every corner of society