Election 2024 and Economic Pessimism

Election 2024 and Economic Pessimism
July 24 | By Dean Sevin Yeltekin & Defne Olgun
In this blog, Dean Sevin Yeltekin and Simon summer intern Defne Olgun take a closer look at the mismatch between economic indicators and voter perception.
The U.S. economy is the envy of the world. According to IMF forecasts, it is on pace to grow at double the rate of any other G7 country this year.
Yet 56% of Americans surveyed in a recent Guardian poll think the U.S. is in a recession. 49% believe the S&P 500 stock market is down for the year, even though it is up more than 12%. The same percentage believe that unemployment is at a 50-year high, even though it is at a near 50-year low.
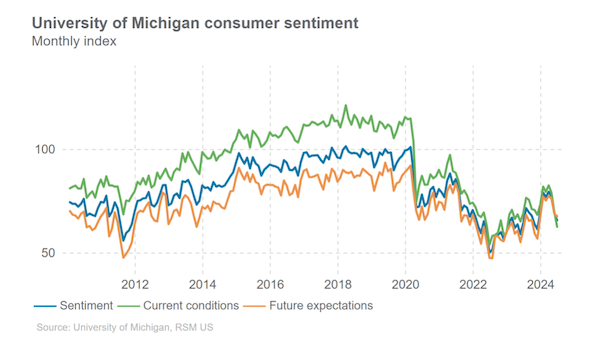
Figure 1
The Michigan Sentiment Index (see Figure 1 above) indicates that after taking a major hit in 2020, consumer confidence has yet to rebound to pre-pandemic levels.
Americans are in a funk, and their malaise is sure to color their perception of elected officials and political candidates. From recent Gallup polls, we know that American voters consider economic problems to be the nation’s most pressing problem. According to the recent Guardian poll (referenced above), a majority of voters attributed the state of the economy, at least in part, to perceived mismanagement from the Biden administration.
It would be easy to attribute all this doom and gloom to the daily onslaught of negative headlines. From wars in Ukraine and Gaza to political polarization to AI-fueled changes in the labor market, there are plenty of reasons to spot storm clouds on the horizon. But while the news cycle shapes our collective perception of the economy, there is more happening under the surface to explore.
Below, we take a closer look at four areas where American consumers may be feeling a pinch, explaining their economic pessimism. Then, we unpack four areas where the economic outlook is rosier than they might imagine.
Four Reasons for Pessimism
1) High housing prices, low housing supply
For an increasing number of Americans, the dream of homeownership is fading fast. The rate on a 30-year mortgage in the U.S. has risen by about four percentage points since a record low in 2021, which would typically predict a drop in nominal housing prices. Instead, nominal prices have barely fallen. U.S. house prices are 6.5% higher than they were a year ago. According to the S&P CoreLogic Case-Schiller U.S. National Home Price Index (see Figure 2 below), the index rose from 212.2 in January 2020 to 310.7 in January 2024. It rose again to 320.4 in April.
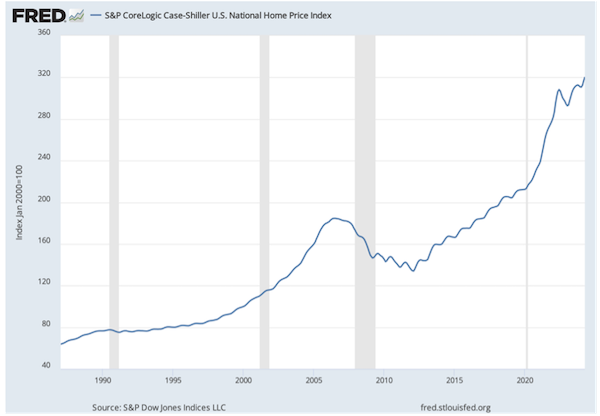
Figure 2
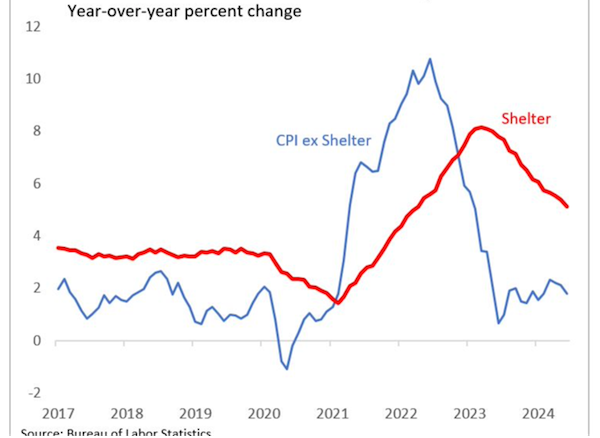
Figure 3
After decades of underbuilding, the U.S. also has an acute shortage of more than four million homes. In the meantime, shelter inflation (see Figure 3) has been slow to adjust, adding to the financial squeeze would-be-homeowners face.
2) Higher mortgage and auto delinquency rates
According to the Mortgage Bankers Association, the delinquency rate for mortgage loans on one-to-four-unit residential properties increased in the first quarter of 2024. This rate signals conditions (such as low personal savings rates) that are making it harder for homeowners to pay their mortgage on time.
The auto delinquency rate also increased in the first quarter of 2024, with 7.9% of auto loan balances transitioned into delinquency on an annualized basis—higher than pre-pandemic levels. While not a huge uptick, this rate is a yellow flag that signals financial stress. We are four years out from the onset of COVID-19, when supply chain issues began to drive up the cost of new cars and decrease the availability of used cars, but the effects of the pandemic linger. Car prices are starting to come down from all-time highs, but with annual percentage rates (APRs) at a two-decade high, consumers are feeling a pinch.
And it’s not just the cost of financing cars that is hurting their wallets—it’s also the cost of car insurance. Nationally, the average cost of full coverage car insurance rose to $2,543 last year, a 26% increase. There are multiple factors driving up the price of premiums to 3.41% of the average American income, including the impact of inflation on parts needed for repairs, a shortage of mechanics across the U.S, and the effects of extreme weather caused by climate change.
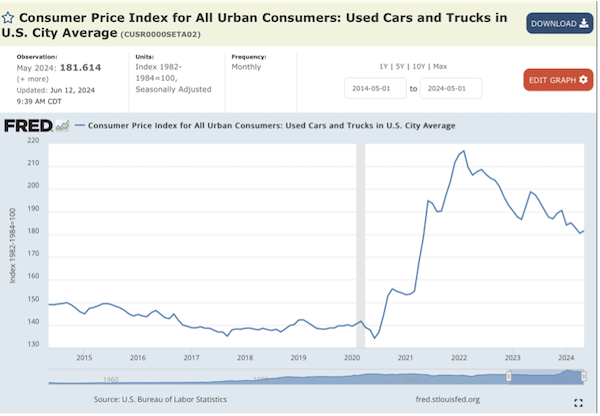
Figure 4
3) High grocery prices
Grocery prices have risen 25% over the past four years compared to overall inflation of 19% during the same period. In a Yahoo Finance/Ipsos survey from last November, 67% of voters said that they thought food prices were hardest hit by inflation. For those whose wages have not risen at the same pace as their groceries—and, according to this in-depth Brookings Institute study, that is a substantial portion of workers—trips to the supermarket are a constant burden.
4) Stimulus money gone
The CARES Act (2020) and the American Rescue Plan Act (2021) injected more than $4 trillion into the U.S. economy. As detailed in our blog posts linked above, American households received direct stimulus payments of $1,200 per adult and $500 per child under 17 in 2020. The next year, they received another round: $1,400 for individuals, $2,800 for joint filers, and $1,400 for each qualifying dependent. They also benefited from expanded unemployment benefits, emergency rental assistance, and deferred student loan payments. According to Moody’s Analytics, Americans build up a $2.7 trillion in savings from 2020 to 2022.
For the majority of Americans, that war chest is now empty. By last fall, according to a Harris Poll survey (see Figure 5), nearly 60% had depleted most of their excess savings. 35% reported spending their stimulus checks on essentials and emergencies, pointing to the strain that basic costs like food, energy, and childcare are placing on household budgets. The cost of childcare is particularly eye-watering for Americans across income levels. An average family spent 32% more for childcare in January 2024 than the 2019 average, according to a Bank of America report. An increasing lack of affordability might be limiting access for lower-income families in particular, as indicated by the drop in the share of lower-income Americans making childcare payments (see Figure 6).\
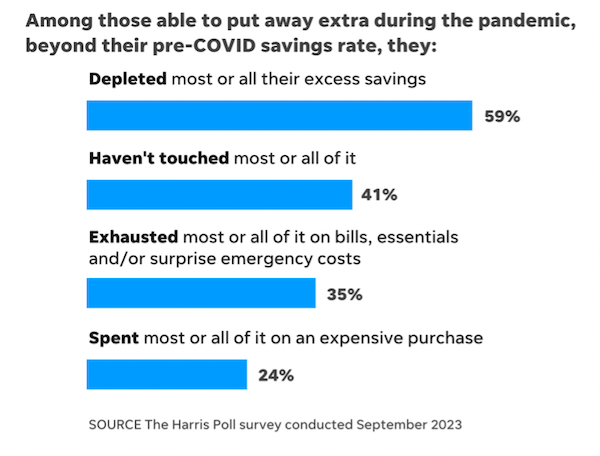
Figure 5
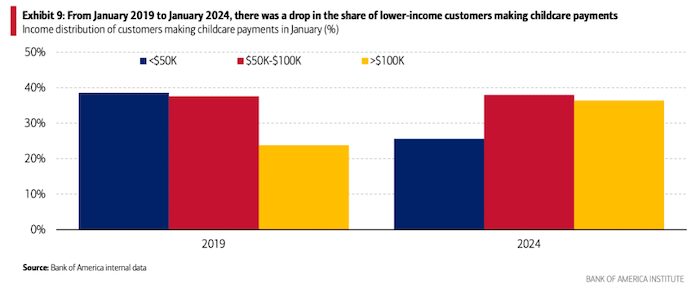
Figure 6
Four Reasons for Optimism
1) Historically low % of income to service debt, total and mortgage
Americans are spending a record-low percentage of their disposable income on debt. In Q4 of 2023 (see Figure 7 below), household debt payments accounted for 9.8% of disposable personal income—this is up slightly from 8.2% in Q1 of 2020, the lowest on record since 1980, but considerably lower than the long-term average of 11.07%.
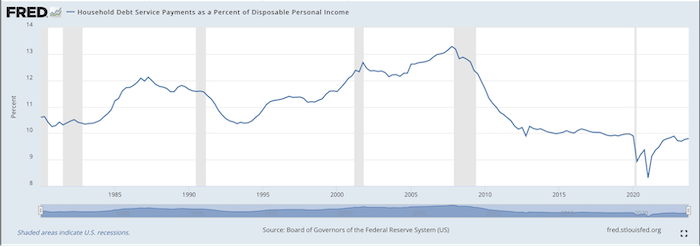
Figure 7
And despite the rise in mortgage rates (see Figure 8) from a historical low in late 2020 (2.67% in December 2020 fixed 30-year rate) to more than doubling by 2023 Q3 (over 7% by Q3 2023), American houseowners are using a smaller portion of their disposable income (about 4% since 2021, as opposed to the 5.3% average between 2000-2020) to service their housing debt (see Figure 9). Average disposable income has risen recently and the “refinance boom” in 2020 and 2021 allowed 14 million homeowners to lock in historically low interest rates, benefiting from low financing costs for decades ¬to come.

Figure 8
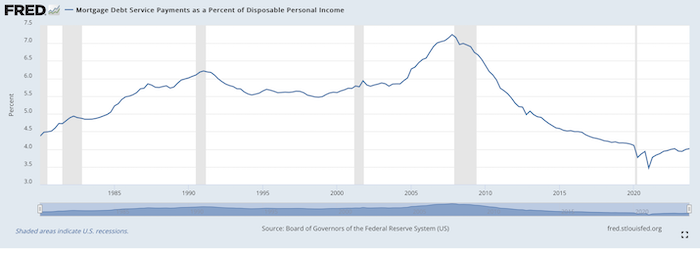
Figure 9
2) Still a tight labor market
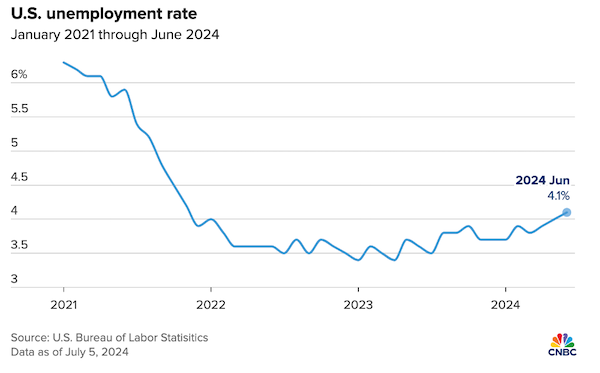
Figure 10
Despite a small uptick in the unemployment rate (from 4% to 4.1% in June 2024, see Figure 10), the labor market is historically strong, with labor participation rates rebounding to pre-pandemic levels. Even the Fed's critics must concede that it has achieved the improbable: a soft landing.
3) Missing workers are back in the labor force
The labor force participation rate (see Figure 11) for U.S. prime-age workers (25-54 years) remains at its highest level in two decades (83.7% in June 2024, compared to historical peak of 84.4% in April 2020). More than 75 percent of all women ages 25 to 54 are currently employed, an all-time high that is mostly due to a secular rise in women’s educational attainment over the past few decades.
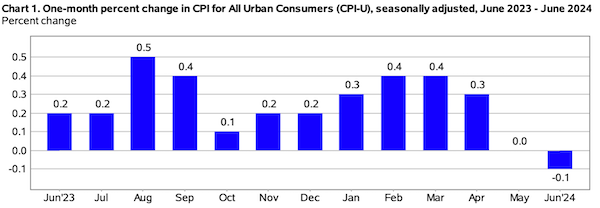
Figure 11
4) Inflation under control

Figure 12
Source: Bureau of Labor Statistics
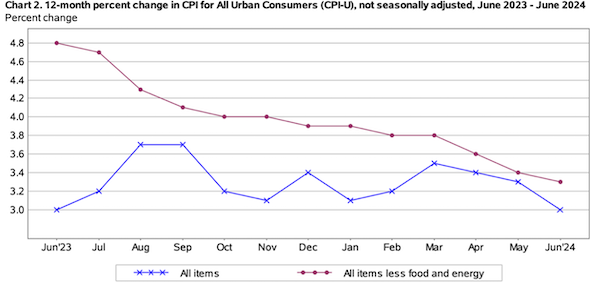
Figure 13
The inflation rate has not yet reached the Fed’s target of 2%, but it is inching along in the right direction (see Figure 12). Year-over-year inflation measured at 3.0% in June 2024, down from 3.3% from the prior month and down from 4% in May 2023 (see Figure 13). While the Fed may hold its benchmark interest rate steady in the 5.25%-5.50% range for the remainder of the year, we will likely see a rate drop in 2025. Many Americans are still reeling from the surge of inflation after the pandemic, but, for now, it is firmly under control.
The Bottom Line
Whenever we witness a gap between public perception and economic numbers, it’s worth the effort to dig deeper. 340 million Americans experience the same economy in vastly different ways, and the reality on the ground goes beyond headline news. In 2024, there is much to celebrate from an economic perspective. Inflation is down, the labor market remains tight, and economic growth continues to exceed expectations. But while a booming economy has translated into a high standard of living for some voters, others feel left behind as they struggle to afford essentials like housing, groceries, and childcare. Every election season is full of uncertainty, and 2024 is certainly proving to be an unprecedented roller coaster. How voter perception will morph amid political twists and turns, not to mention intervention by the Fed, is anyone’s guess.


Sevin Yeltekin is the Dean of Simon Business School.
Defne Olgun is a double degree student in Quantitative Economics and Finance and Studio Art at Tufts University.
Follow the Dean’s Corner blog for more expert commentary on timely topics in business, economics, policy, and management education. To view other blogs in this series, visit the Dean's Corner Main Page.
Comments
Thanks!
Submitted by Thomas Rocco, MD (not verified) on Thu, 07/25/2024 - 08:20
International Trade versus International Capture
Submitted by Charles Masick (not verified) on Thu, 07/25/2024 - 01:24
International Trade versus International Capture
Submitted by Charles Masick (not verified) on Thu, 07/25/2024 - 01:08
Add new comment